The Center for Air Pollution Mitigation (CAPM), under the Pollution Control Department (PCD), reports daily air quality updates, including PM2.5 levels, to the public through the AIR4THAI Application, the official Facebook fan page, and the website www.pcd.go.th. There has been feedback from various stakeholders requesting CAPM to clarify the presentation of PM2.5 data in the AIR4THAI Application. Therefore, CAPM would like to provide the following guidance on how to read and search for PM2.5 data for both 24-hour and hourly averages:
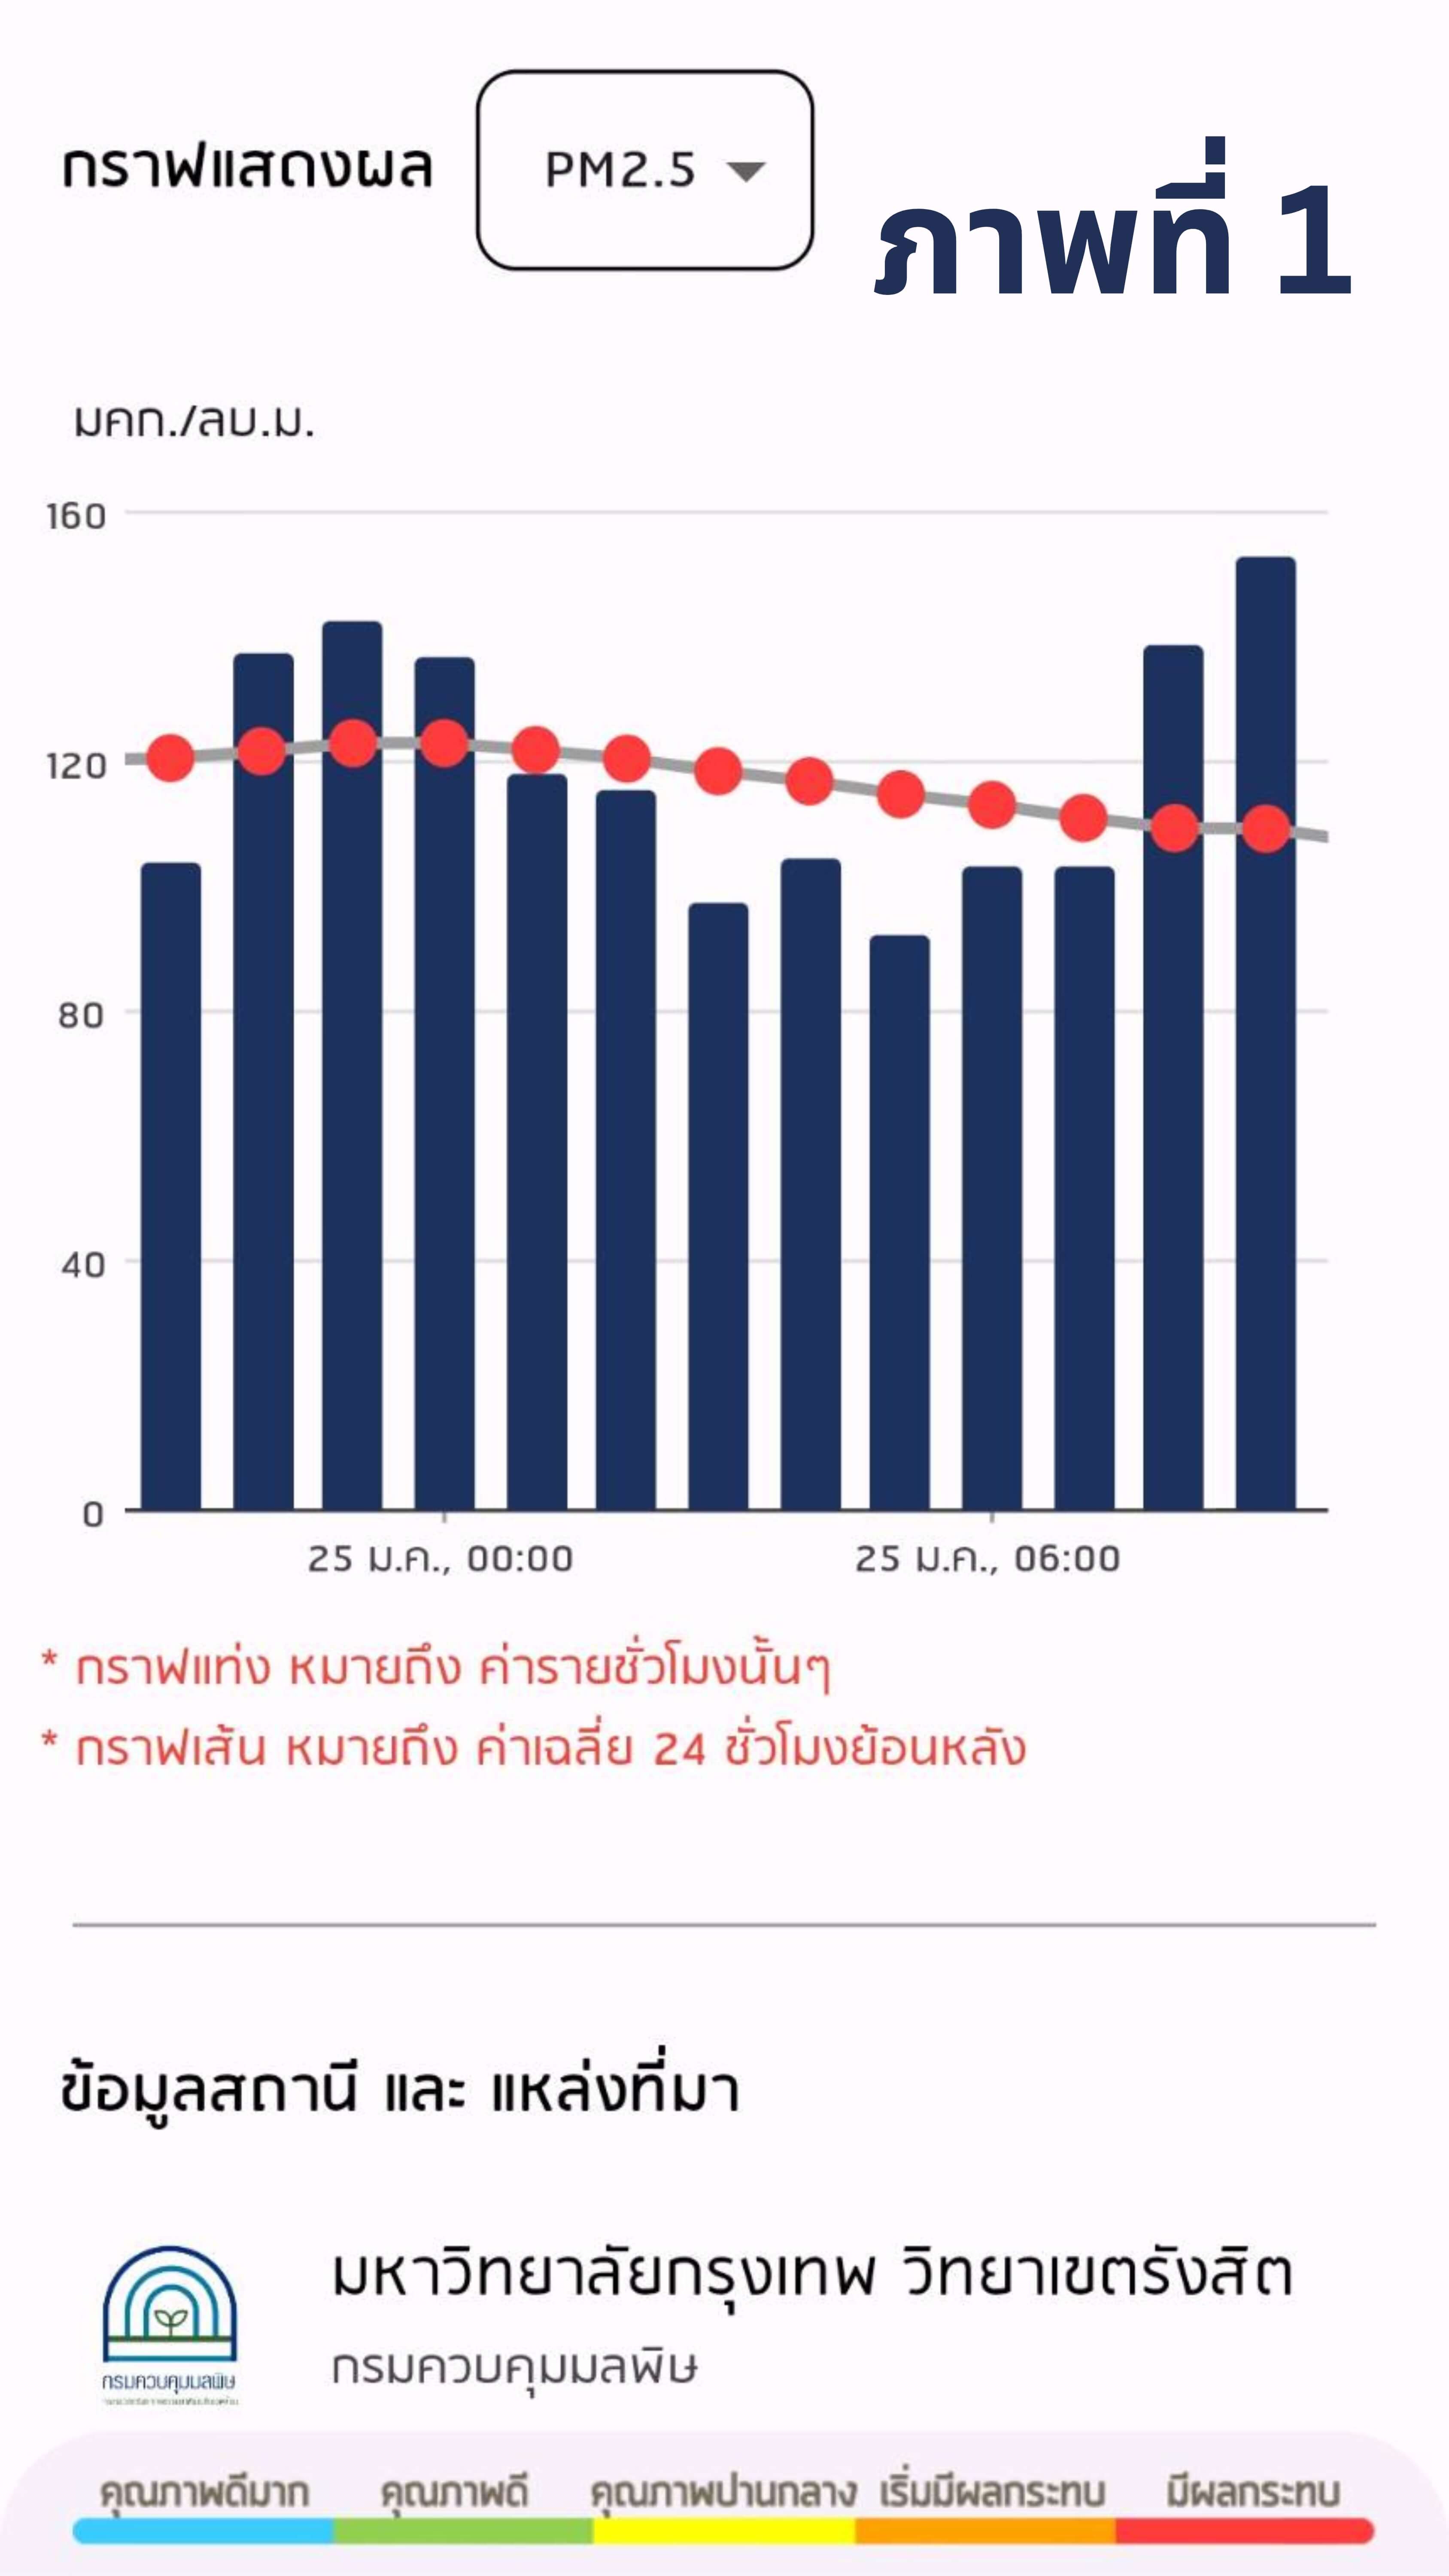
- To read the PM2.5 levels in the AIR4THAI Application, look at the number inside the circular icon with a face. This number represents the PM2.5 levels at the monitoring station closest to your location. This value is a 24-hour average, updated hourly based on measured data. If you want to check the hourly PM2.5 levels, scroll down to find the bar graph (Figure 1). By tapping on a bar, the screen will display both the 1-hour average PM2.5 level and the 24-hour average PM2.5 level simultaneously.
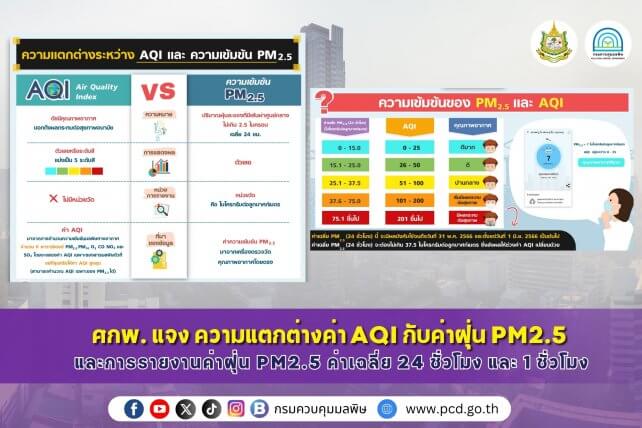
- PCD reports daily PM2.5 levels using the 24-hour average to compare with Thailand’s 24-hour air quality standard. This measurement reflects the level of air quality and its impact on public health, helping people take necessary precautions. This approach aligns with the recommendations of the World Health Organization (WHO) and the United States Environmental Protection Agency (US EPA), as well as air quality monitoring practices used worldwide. Meanwhile, the hourly PM2.5 level (1-hour average) helps government agencies analyze trends and detect anomalies in air quality more quickly. It also benefits the public by allowing them to plan outdoor activities based on current air quality conditions.
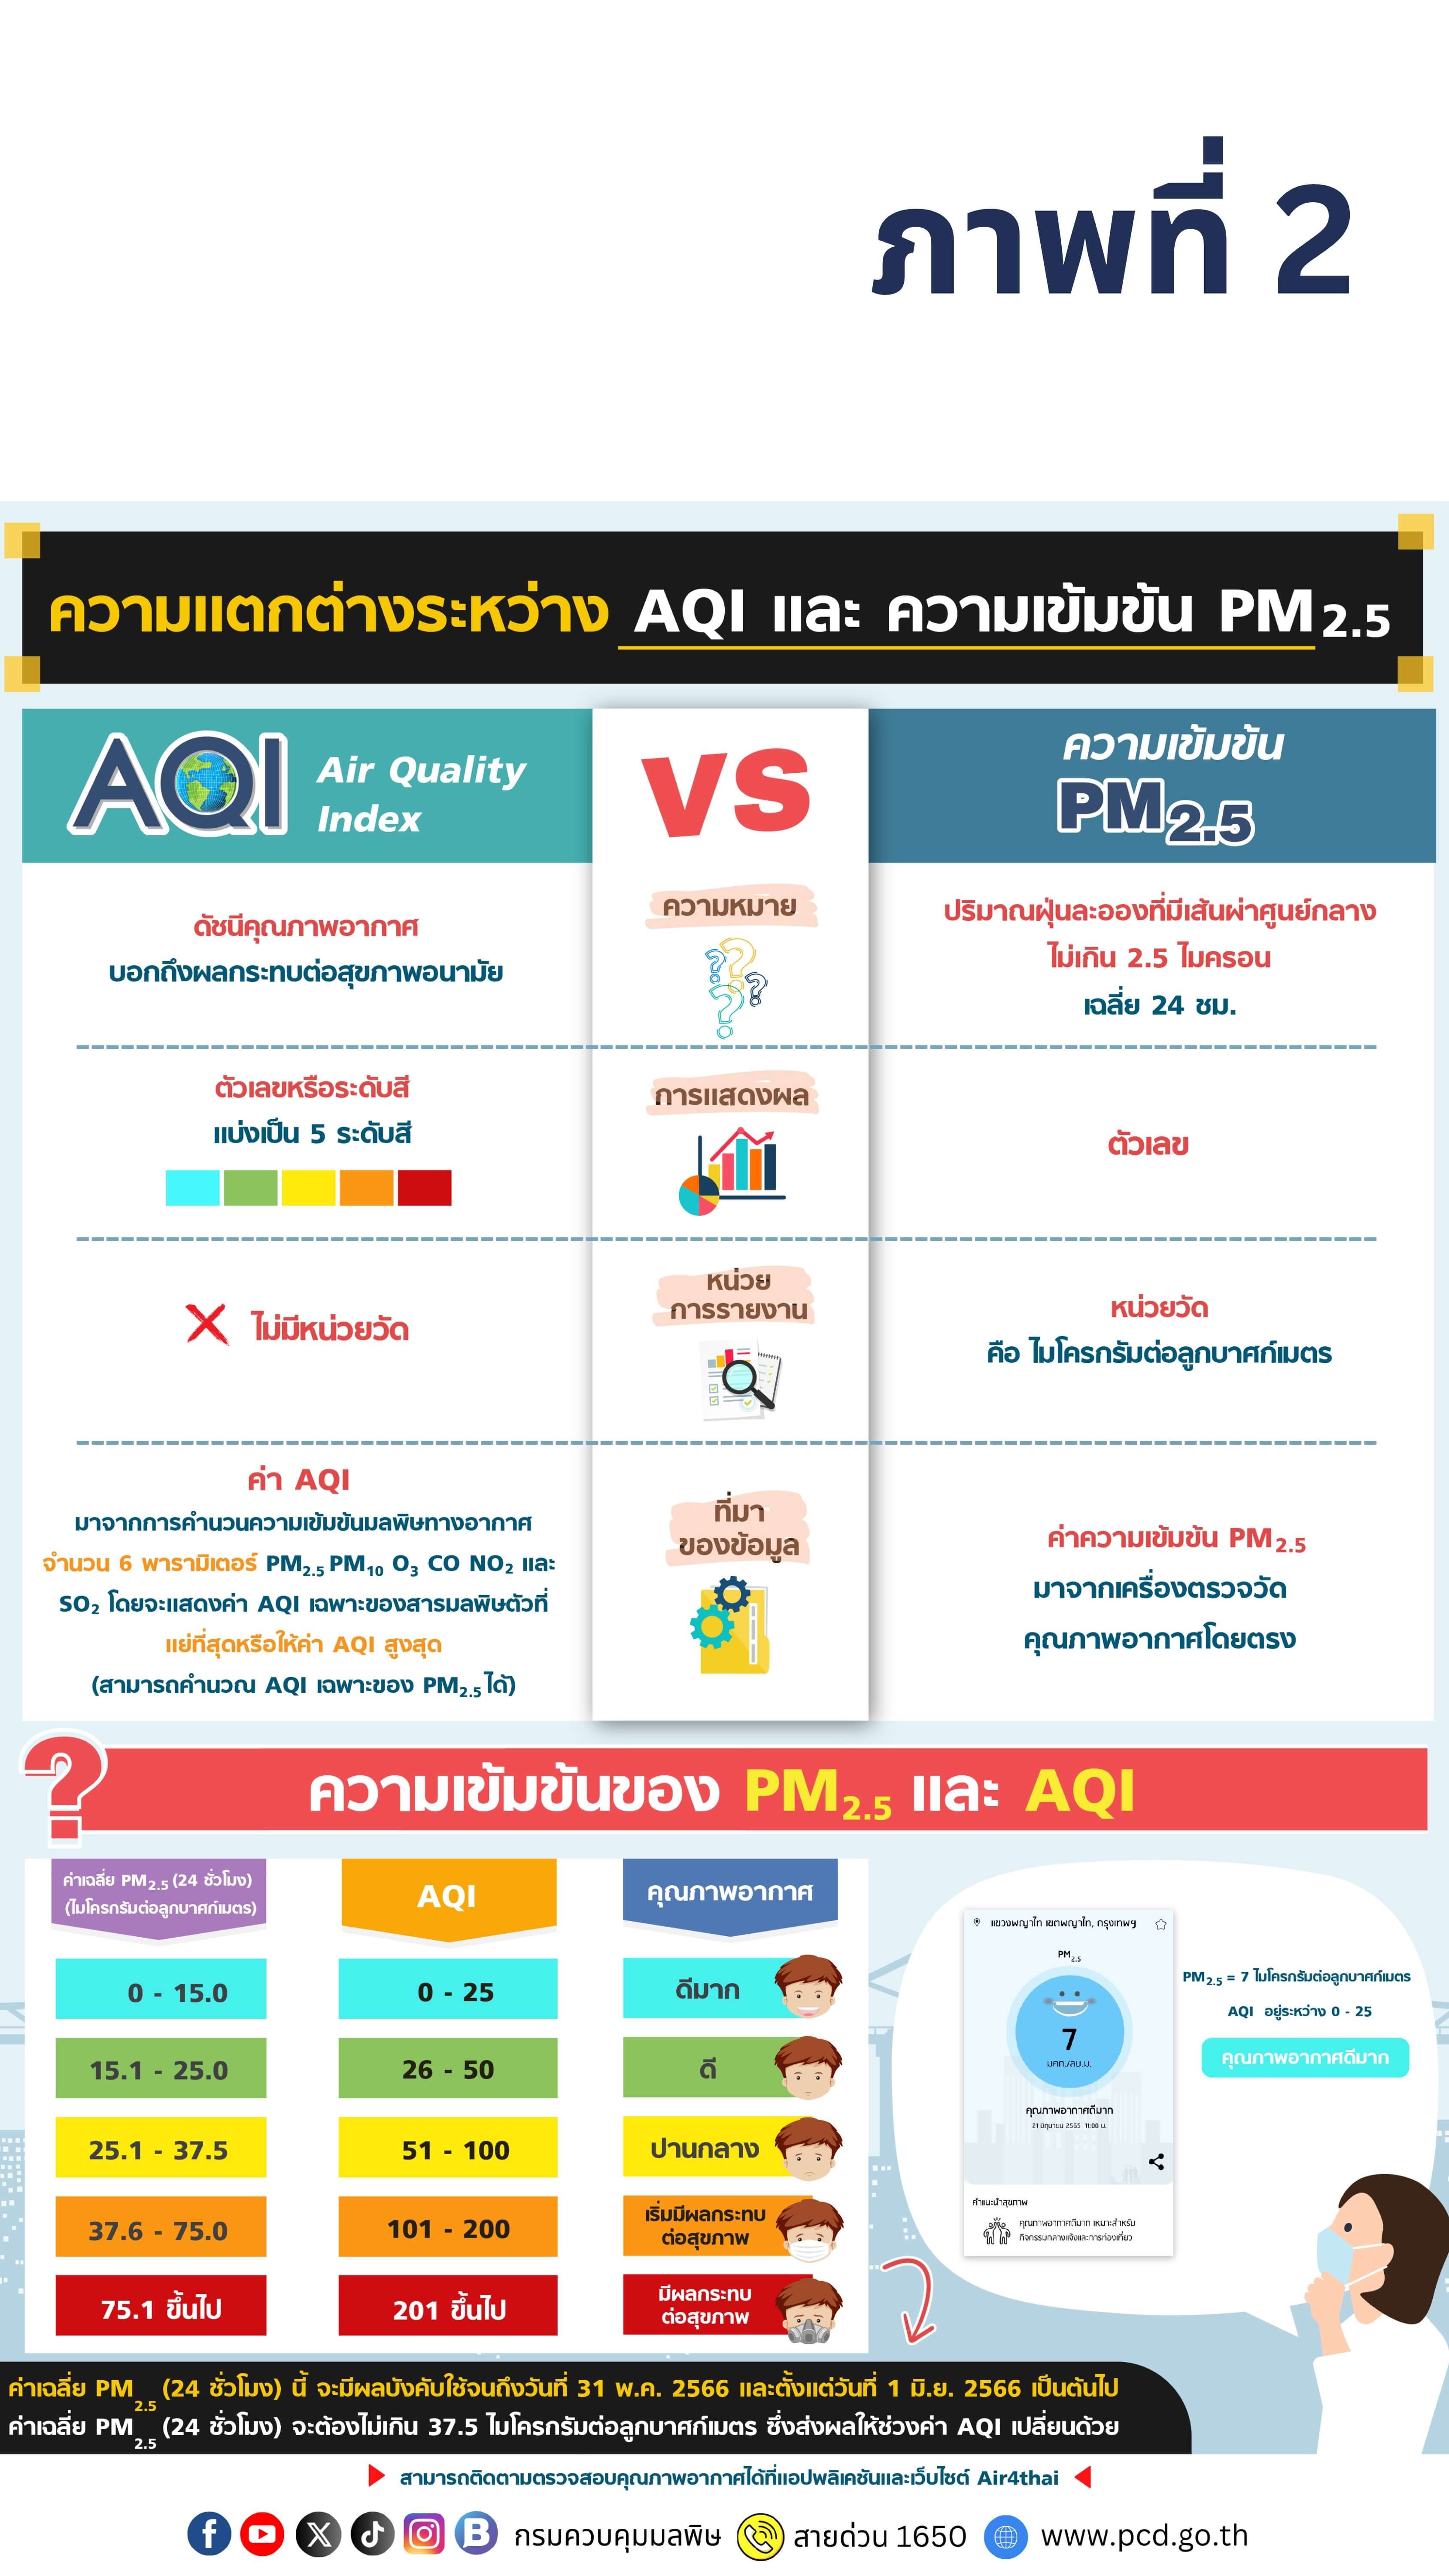
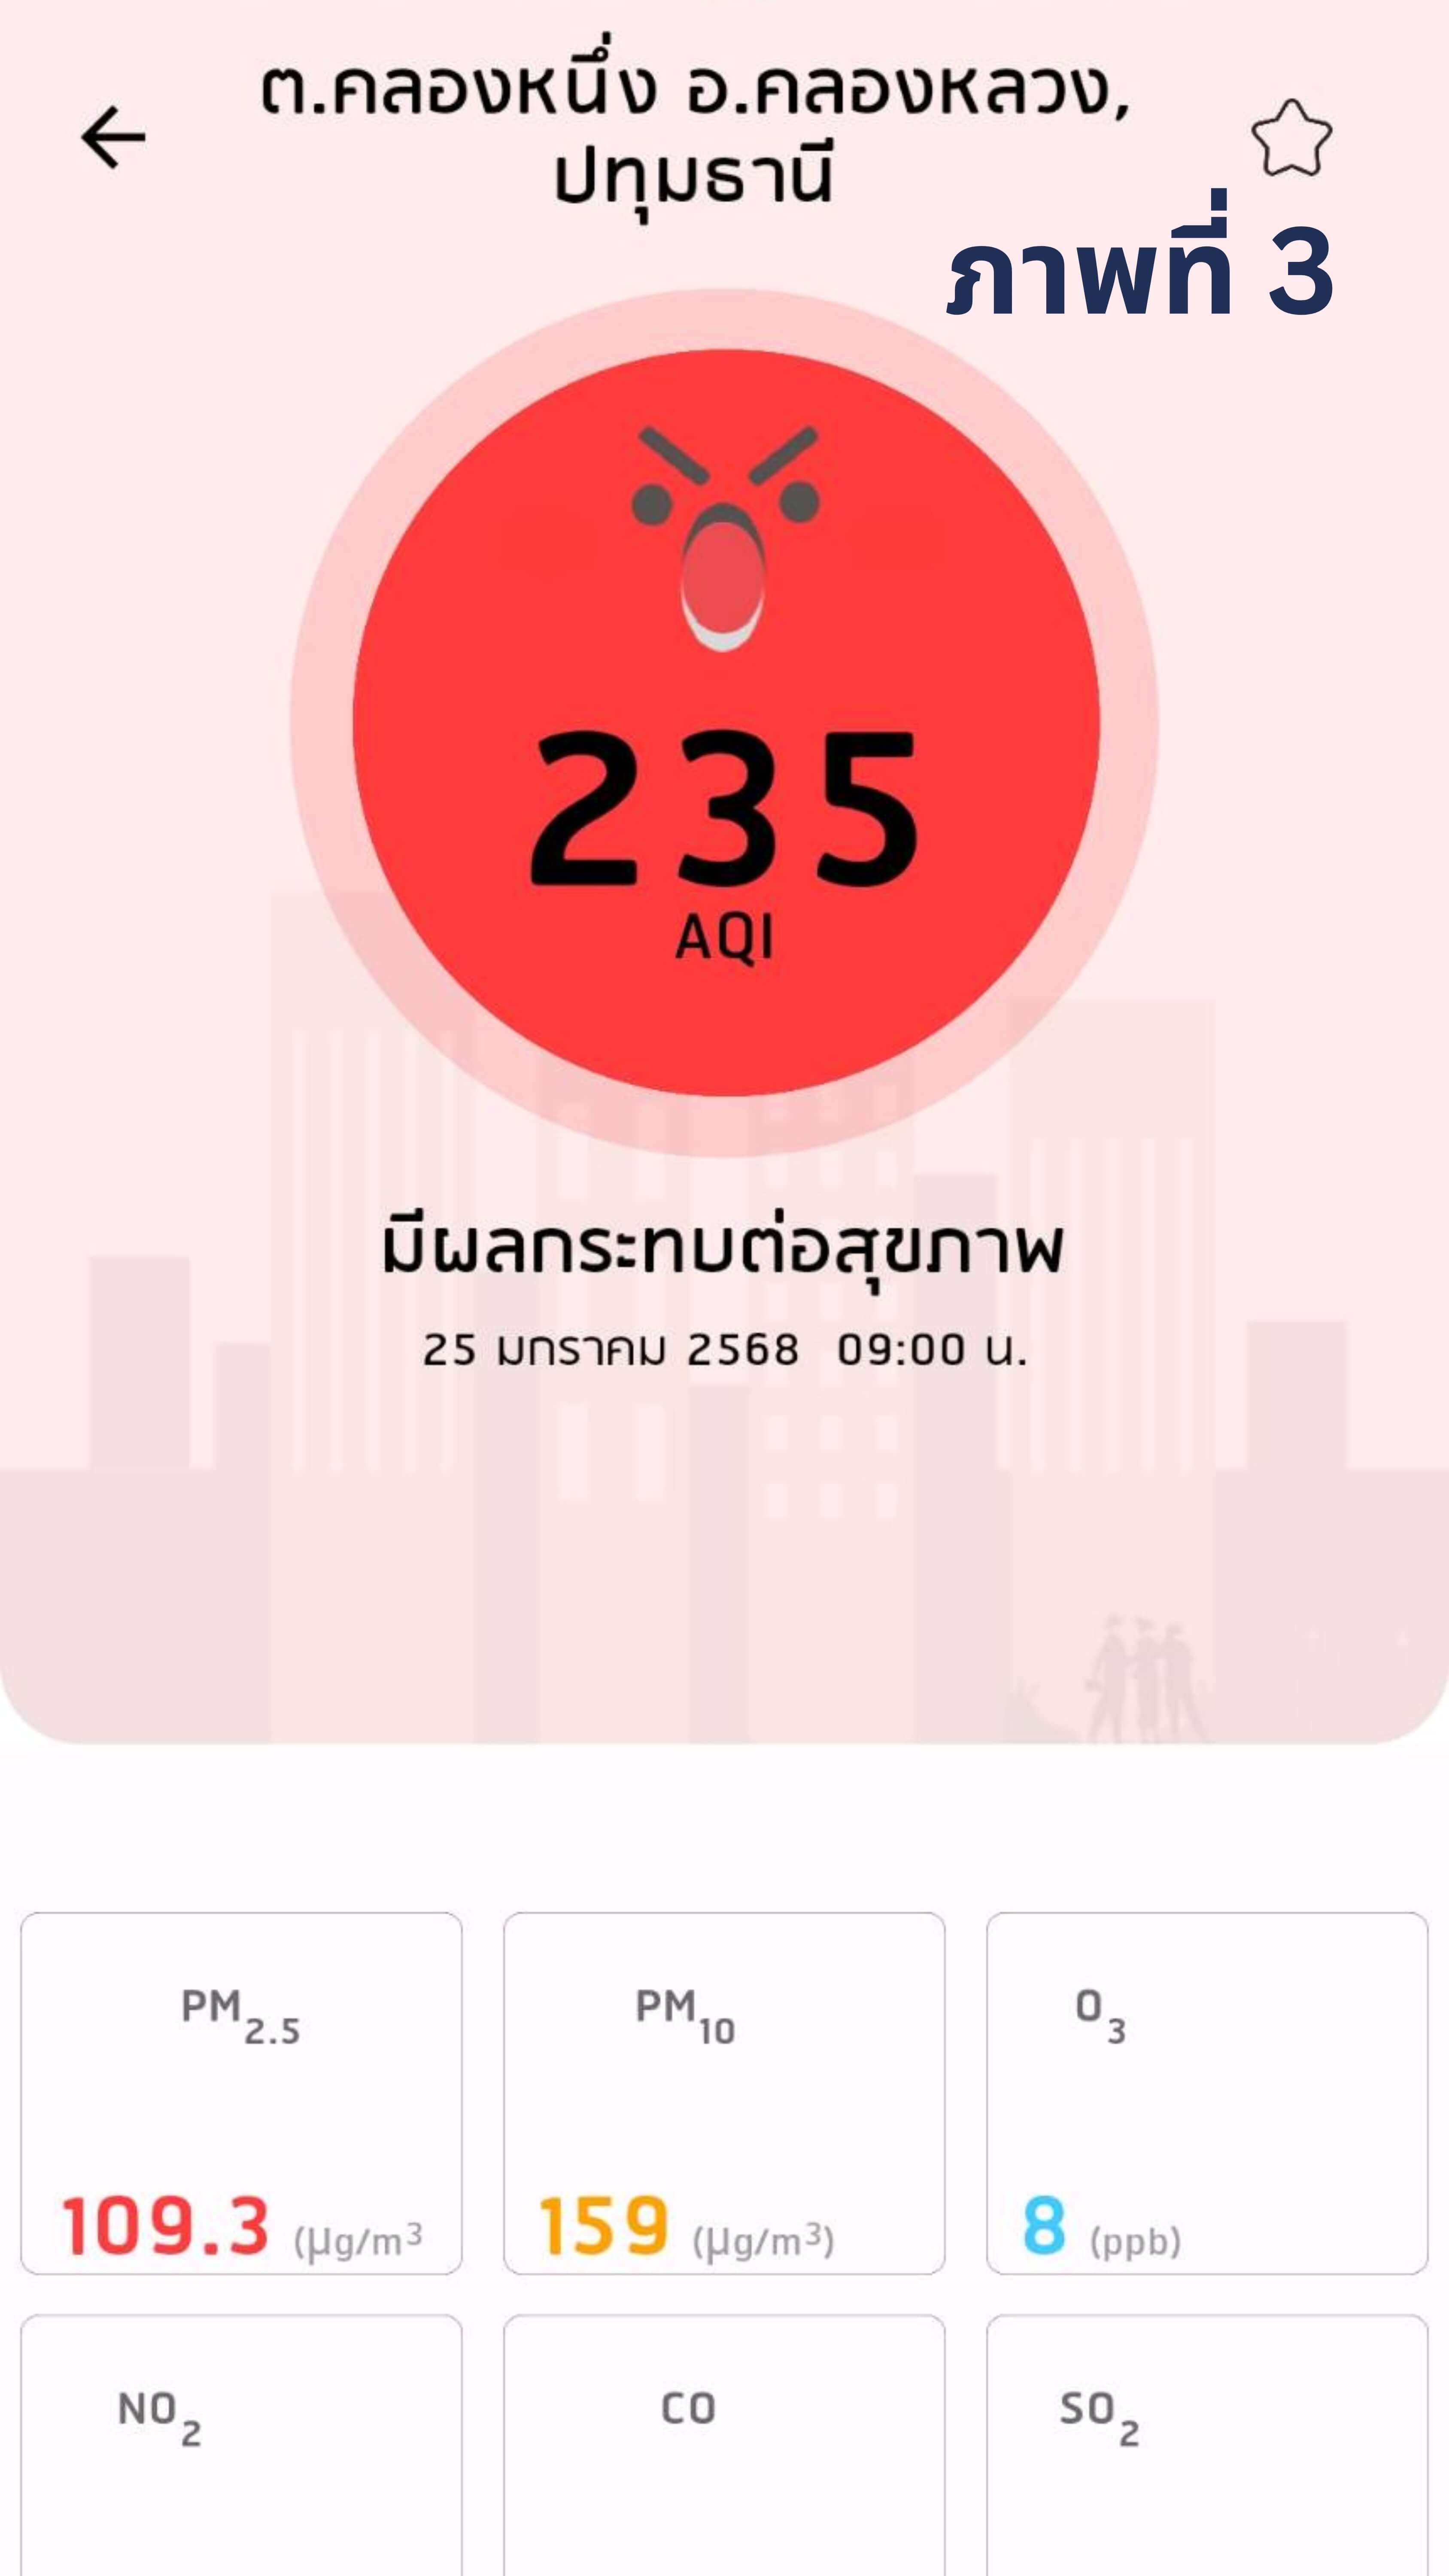
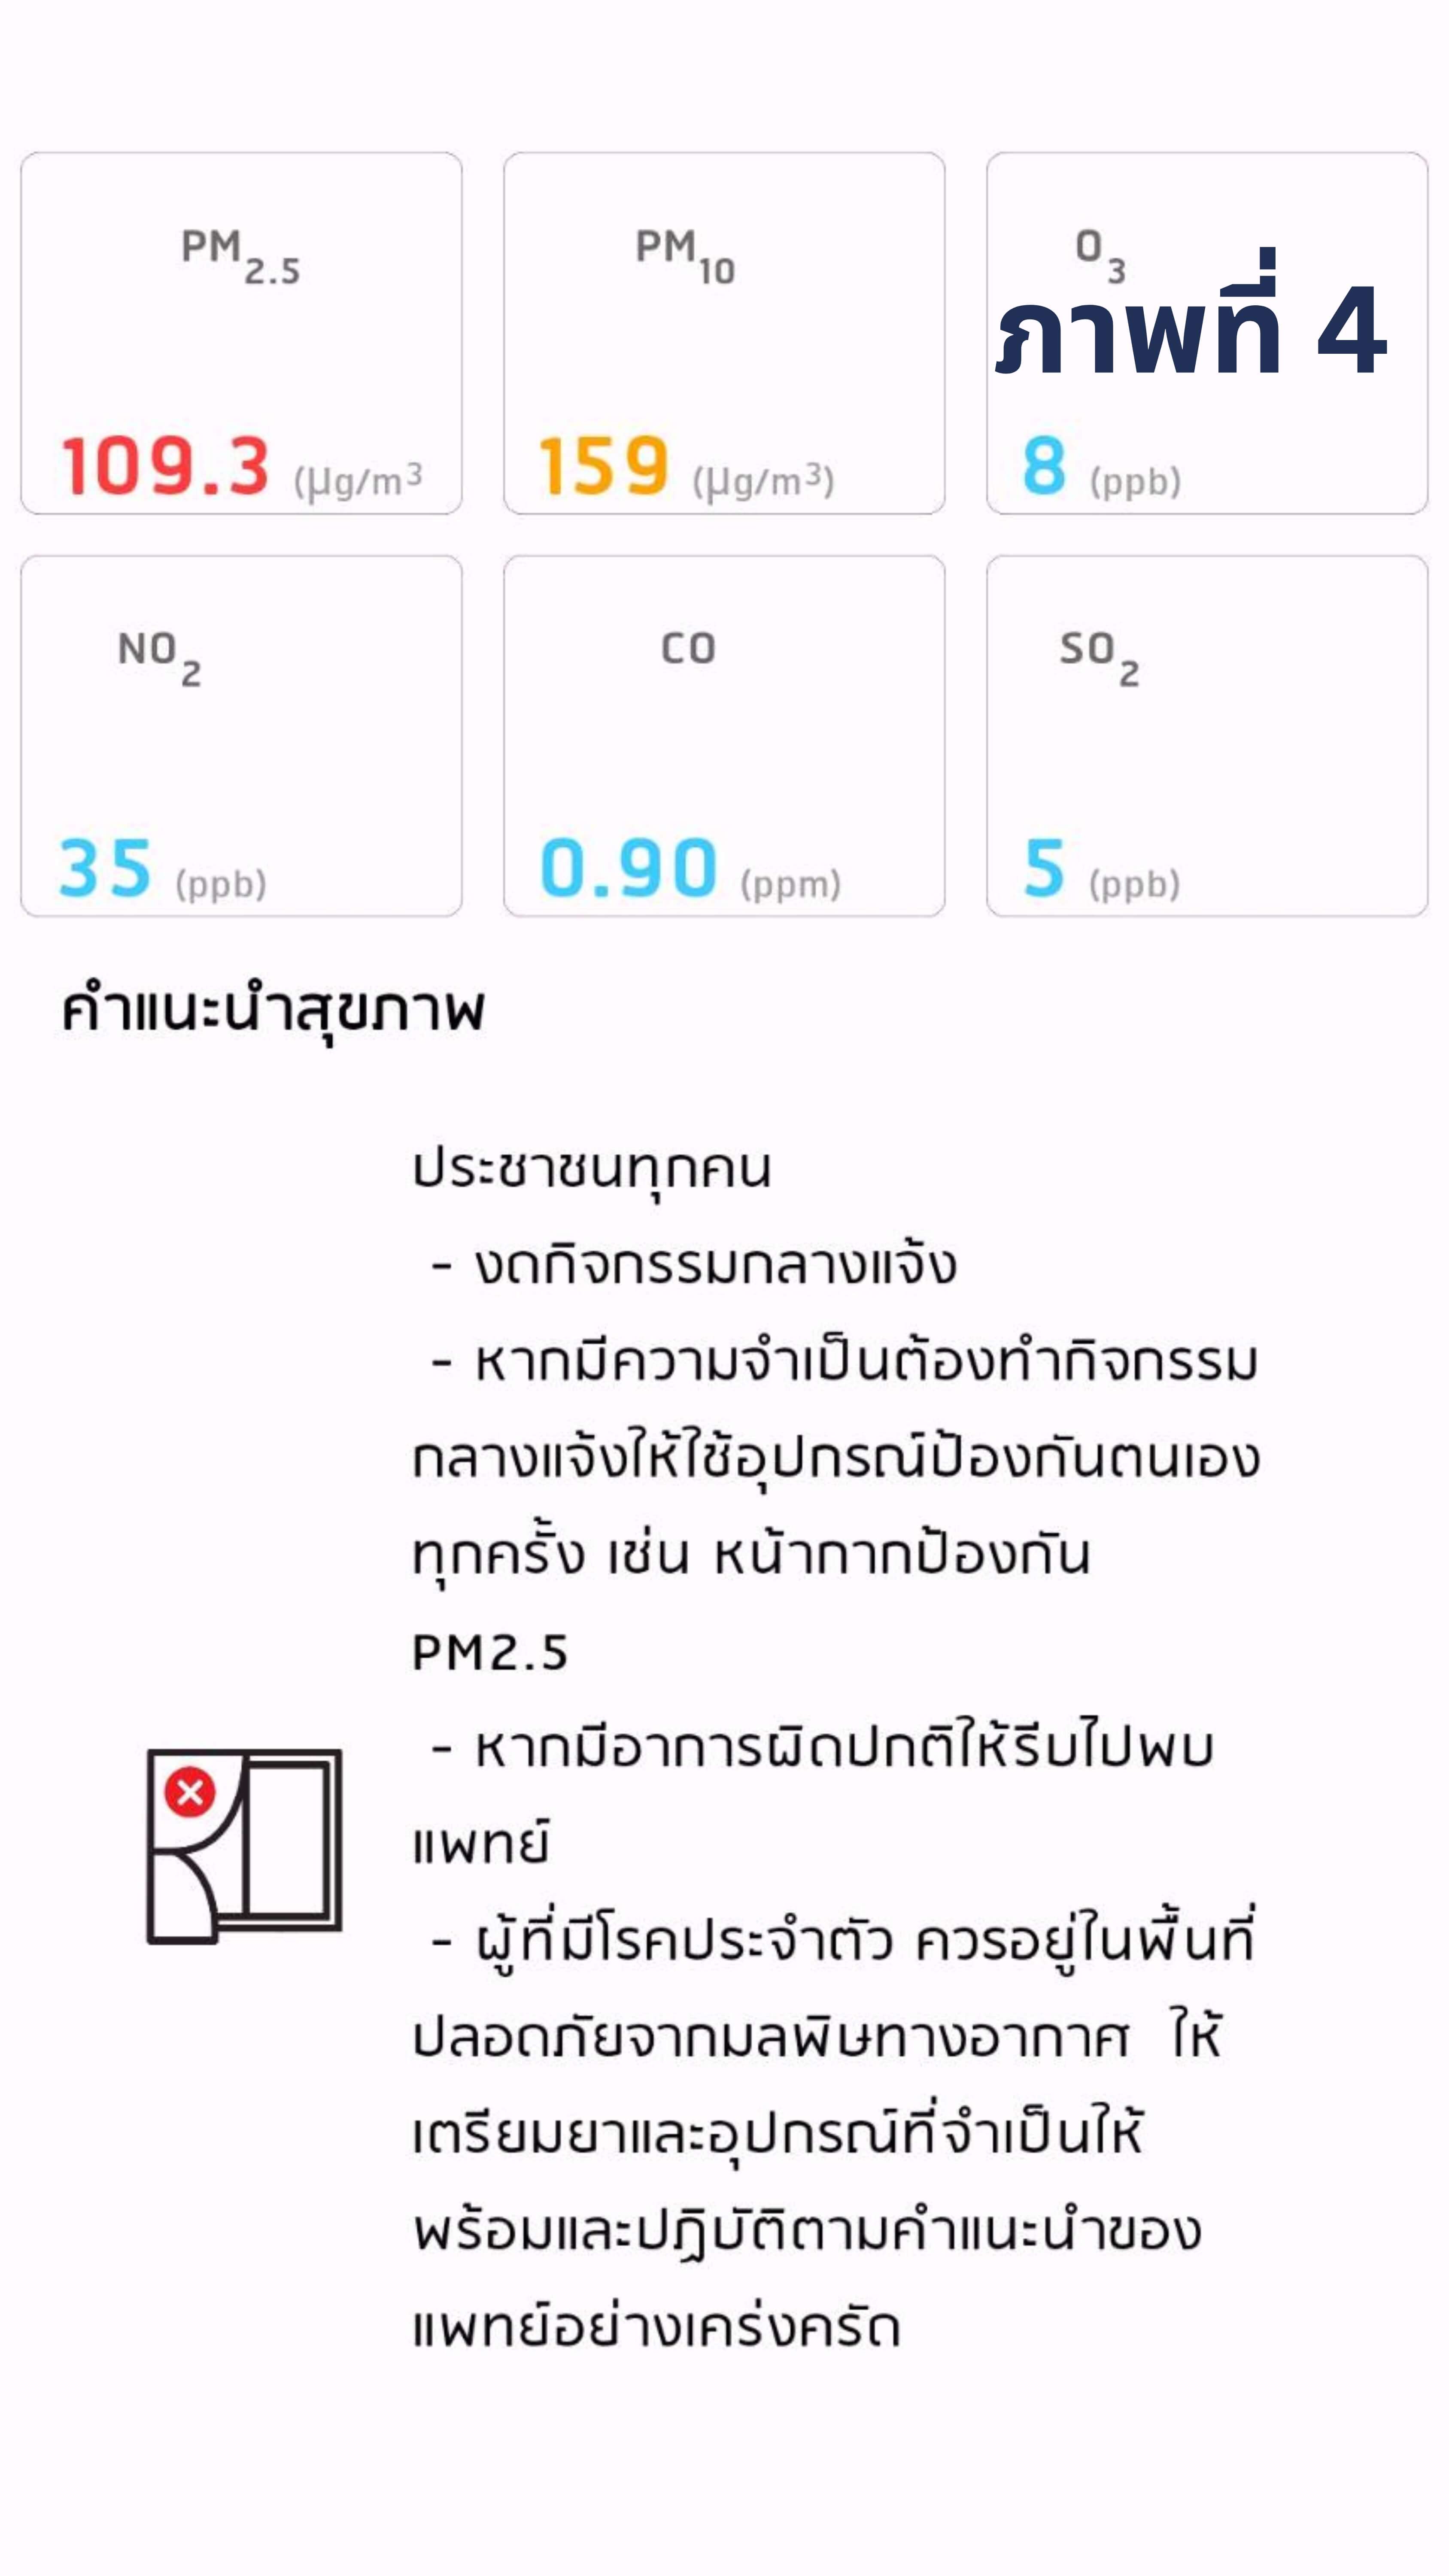
- The Air Quality Index (AQI) is not the same as the PM5 level (Figure 2). AQI is a unitless index designed for easy interpretation, using color codes based on Thailand’s Air Quality Index standards. It is calculated from six monitored pollutants: PM2.5, PM10, O3 (ozone), CO (carbon monoxide), NO2 (nitrogen dioxide), and SO2 (sulfur dioxide). The pollutant with the highest concentration determines the AQI value at a given time. In contrast, PM2.5 level refers specifically to the amount of PM2.5 particles in the air, measured in micrograms per cubic meter (µg/m³). For example, an AQI of 235 (Figure 3) and a 24-hour average PM2.5 level of 109.3 µg/m³ (shown in the lower box) (Figure 4) does not mean that the PM2.5 level is 235. Miscommunication of this information can lead to unnecessary panic.
CAPM confirms that the air quality data in the AIR4THAI Application is sourced from standardized monitoring stations. We are happy to provide information that promotes accurate understanding for public benefit. If you have any further questions, please contact us via PCD fan page or the Center for Air Pollution Mitigation (CAPM) fan page.
แกลเลอรี่